
The rise and fall of the Hockey Stick
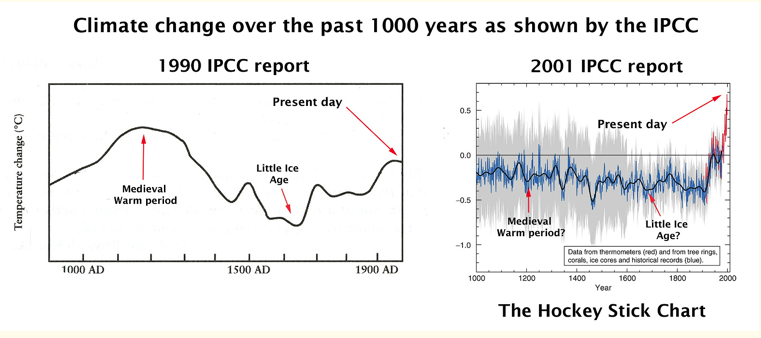
To push the Kyoto Accords in 2001 after the 9/11 attacks, the first graph from 1990 was eliminated and a new one showing a hockey stick warming was used by the IPCC. Propaganda was pushed warning us we were going to be terrorized by warm weather and all die unless…oil and gas was taxed very high! This was agreed at the Bilderberg meeting which is why Al Gore was used to push this storyline hard. The controversy about how this hockey stick was created rages today. We are going to review this controversy in my own way, first, the debate:
Here is the final position of the crew at Skeptical Science’s Global Warming and Climate Change skepticism examined website: What evidence is there for the hockey stick? 
Here is their ‘news’ that is ‘science’ which is ridiculously stupid:

They have a number of bullet points on this page showing that 2014 was super duper hot. Wait! They don’t! They have hot PREDICTIONS but no events from this cold winter! They also mention a ‘bumpy start’ to the global warming scare campaign. HAHAHA. While blizzards and wet weather, extreme cold and such assail huge parts of the planet, there is zero mention of any of this. It does mention some possible nomads living in Outer Mongolia who may be having problems due to it being ‘warmer’. Here is Ulan Bator’s temperature history for the last 70 years: Ulan bator temperature – Wolfram|Alpha 
Yes! A slight warming over the last 70 years but with some huge drops in temperature several times. The last super high was in 1988 and the super low was…2001. the main thing is, there is no hockey stick run up in temperatures over this span of time which is not including the 1920-1940 heating up which was very much ‘global warming’ in nature except it stopped.
The Ulan Bator chart shows it not getting hotter in the last 10 years but cooler with a slight rise from well below the red line average in the last year. The question is, why do these fake scientists who profess to be ‘skeptics’ so easily fooled? Why are they worried about some desert tribes south of Siberia while ignoring 2/3rds of North America which froze way below average this year? I doubt they are Mongolian shepherds.
I believe they are mainly Americans and do they all live in California and Florida, the only places not to see record cold this winter? Anyone calling themselves ‘skpetics’ should be less foolish. The recent release of the IPCC report that lied about the content of the report is yet another nail in the global warming coffin: A must-read that takes apart the IPCC report summary here: Mail on Sunday Reveals How IPCC ‘Sexed Up’ UN Climate Report | The Global Warming Policy Foundation (GWPF)
According to Rajandra Pachauri, the UN Intergovernmental Panel on Climate Change (IPCC), its report last week was its most terrifying yet, portending famine, disease, extreme weather and wars, proving ‘no one on this planet is going to be untouched’. But a Mail on Sunday analysis shows that the 47-page ‘summary for policymakers’ of a much more detailed 2,600-page document – ‘sexed up’ some of the key findings.
I like to go back in time to see previous material. From August, 2009, just when the global cooling began to show up in data: AGW is a thermometer count artifact | Musings from the Chiefio: E.M.Smith
IMHO, the whole AGW thesis is based on False Precision with folks dancing in the error bands of calculations from whole degree F records into 1/10 and 1/100 degree C mathematical paranoid fantasies; on a broken concept of a “Global Average Temperature” (when it clearly is NOT “global” given the seasonal variation in the raw data; which is all we really have…) nor does the “Average” of a bunch of thermometers mean anything at all (what is the meaning of the global average phone number? The global average car color?) nor is the thing you come up with by averaging a non-Nyquist set of data a “temperature”… But:
This is also my beef. There is never a ‘global average’. It can be created artificially. We do know there are cold and warm cycles based on evidence such as glaciation or melting ice. But this is never even across the planet, by nature, it is a spotty affair. One place can chill much more than others at the same latitude or longitude. This is why Alaska and the Bering Strait were much warmer than Hudson Bay or the lower Hudson River valley in New York during the Ice Ages. Australia is much warmer than South Africa even though they are the same distance from Antarctica.
The southern half of Greenland is the same distance from the North Pole as Norway yet Norway is much warmer. We can assume planetary cooling or heating based on many pieces of a very complex puzzle but if one screws up the data even slightly it stops working as a predictive tool. And we see this very clearly today as global warming vanished like dew on a sunny day. This article covers the pursuit and destruction of the IPCC hockey stick regime: The rise and fall of the Hockey Stick
McIntyre and McKitrick then took their critical analysis a step further. When you apply a statistical manipulation to a set of data it is important to make sure that what you doing is not actually distorting the data so much that you are really just creating something new, spurious and false in the numbers. One way to do this is to take the statistical manipulation in question and apply it to several examples of random numbers (sometimes this is called a Red Noise test).
To simplify, you use random numbers as input data, then apply the statistical technique you are testing to the random numbers then if the techniques are sound you should get a set of random numbers coming out the other end of the calculations.
There should be no false shape imparted to the random noise by the statistical techniques themselves, if what you get out is random numbers then this would prove that the techniques you were testing were not adding anything artificial to the numbers. This is what McIntyre and McKitrick did using the techniques that Mann had used in the Hockey Stick paper. And the results were staggering.
What they found was that 99% of the time you could process random data using Mann’s techniques and it would generate a Hockey Stick shape. This meant that Mann’s claim that the Hockey Stick graph represented an accurate reconstruction of the past climate was in tatters…
McIntyre and McKitrick submitted a letter to Nature about the serious flaws they had uncovered in the methodology used in the Hockey Stick paper. After a long (8-month) reviewing process Nature notified them that they would not publish it. They concluded it could not be explained in the 500-word limit they were prepared to give McIntyre and McKitrick, and one of the referees said he found the material was quite technical and unlikely to be of interest to the general readers!
Instead of publishing anything from McIntyre and McKitrick explaining the serious errors that they had found Nature allowed Mann to make a coy correction in an on-line Supplement (but not in the printed text itself) where he revealed the nonstandard method he had used, and added the unsupported claim that it did not affect the results.
Nature magazine did exactly this to my dad with his ‘The Sun Is A Variable Star’ paper. They told him it was hard to believe, they couldn’t accept the data, that this was ‘scary as hell’ and thus, not good to read! This got my goat in particular since they spend a lot of energy trying to scare everyone to death with endless papers about how we are going to roast to death.
The editors refusing to publish the refutation of the Hockey Stick paper is disgusting. Just like many media outlets, most of which are owned by members of the Bilderberg gang, refuse to allow comments about this matter anymore. At warmists sites like Skeptical Science, they ban anyone who refutes their insane theology. Now, this morning I decided to have some climate fun by looking at graphs of various equatorial cities to see if there is a hockey stick hidden amongst the palm trees: Singapore temperatures – Wolfram|Alpha

Kuala Lumpur temperatures – Wolfram|Alpha

So, both of these Asian cities had a very slight, gradual warming from the cold era of 1940-1960. Now, the temperatures in these watery cities varies little from winter to summer being equatorial. So yes, it warmed ever so slightly but no hockey stick, not even a hint of one. Now to a South American city on the equator: Bogota columbia temperatures – Wolfram|Alpha

Whoa! A reverse hockey stick! It was much warmer before 1960 and then temperatures declined over the following 50 years! Absolutely no global warming there. Libreville gabon temperatures – Wolfram|Alpha

Belem Brazil temperatures – Wolfram|Alpha

Africa and Brazil are pretty flat. The last high was in 1975 and the lowest low was also 1975. Whereas in Africa, the lowest low was in 1993 and the high was in…hahaha…1993, too! Now off to Darwin’s favorite island cluster in the Pacific where the la Nina and el Nino events originate: Galapagos Islands temperature – Wolfram|Alpha

NO hockey stick here at all. Indeed, it goes way back showing the 1930’s heat waves that hammered the Midwest, too. It was much, much warmer back then! Fell like a rock and is now barely average. It shows temperature DECLINE, not a heat hockey stick! So what will give us this sticky stick?
And that observation will not go away in “zonalizing”, homogenizing, pasteurizing, or any other *izing you come up with. Spread the thermometers far and wide. Make them zones, boxes, cells, “whatever”. Focus them into a single continent (AGW would still have that continent warming…) There simply is no “warming” signal in those temperature records. (If there were warming, the average would go up to some degree over time for a fixed set of thermometers – even though I think the method is fraught with “issues’… ) And there is NO WARMING SIGNAL in a relatively fixed set of thermometers.
I agree with the above statement from the Rise and Fall of the Hockey Stick website. Here is a comment from Dr Alexander E McClintock from Australia using the Weather station directory – Bureau of Meteorology:
Very interesting! I can confirm a similar trend in Australian records. I picked out some stations with a long history. Some going back to 1880. I picked the locations where I did not expect heat island contamination. In the isolated country locations there was no upward trend and in several cases a statistically significant downward trend. (e.g. Bathurst Prison, Deniliquin). you can access the raw data from. http://www.bom.gov.au/climate/cdo/about/sitedata.shtml There was a clear upward temperature trend in the big cities – about 0.6 degrees centigrade per century.
So, to see if he is correct, I decided to do some Australian cities: Perth temperature – Wolfram|Alpha 
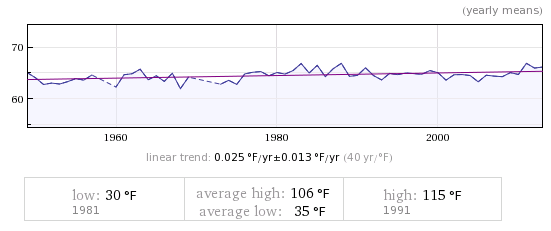
Syndey australia temperature – Wolfram|Alpha

Very slight warming since 1950. If this went back to 1030 like the other graph above, we would have temperature decline, not slight warming. No hockey stick here, either. I do see that the super hot day is 1991 in Perth but Syndey had it in 2013. Both super lows were in the early 1980’s. Still, the only ‘hockey stick’ event here is the peak in the Sydney graph in 1958. Maybe the hockey stick is in Africa where it is the same distance from the South Pole as Sydney: Cape town South Africa temperature – Wolfram|Alpha

Shows a slight warming but generally small changes up or down with downward dominating the last decade. Here is another site the same distance from the South Pole in South America: Rio Gallegos. Argentina temperature – Wolfram|Alpha

VERY choppy in 1960, I surmise the jig downwards in 1963-67 is from the Agung eruption in Indonesia. Otherwise, it is pretty much flat as a tire that was punctured by a screwdriver.

 Email:
emeinel@fairpoint.net
MAILING ADDRESS:
EMS NEWS
P.O. BOX 483
BERLIN, NY 12022
Make checks out to ‘Elaine Supkis’
Click on the Pegasus icon on the right sidebar to donate via Paypal.


one problem , one needs training in statistics to understand this stuff,
http://www.realclimate.org/index.php/archives/2005/01/on-yet-another-false-claim-by-mcintyre-and-mckitrick/
as i said earlier , i think both sides are correct, entropy rules! maximum disorder!
The Big Hockey Stick should at least be supported by Small Hockey Sticks. I see NONE. Having a ‘collective’ hockey stick while no data shows hockey sticks means…the defense of the IPCC hockey stick graph is insane.
I was a student at Queen’s University, Kingston, Canada in the summer of 1971…I had an engineering buddy whose Mum was major intellect with “Group of Rome” and he had a copy of the document they published before it was released. You do intrigue me Elaine…but my position is you are wrong on this one….In my opinion you are absolutely right/correct/courageous on the other 99% of the positions you take;>)
http://takimag.com/radioderb/climate_science_climate_politics_john_derbyshire#axzz2y9h0Nx2x
Mike, the problem with all this noise about the climate is the PROJECTION going on as if we are not on the knife’s edge of another Ice Age. Wild things are suggested on meagre recent data which ignores the huge glacier glaring at us.
We know for a fact that repeatedly, and furthermore, with little warning, longer and longer Ice Ages occur. They come like clockwork. At no point in time in the last 5 million years has extensive warming happened, it is the opposite.
This worry about warming puzzles me because we had yet another hard slap from the Ice Age monster this winter! A sharp reminder who to fear the most.
in geologic time whats a knife’s edge ? 200 yrs 2000/
Reblogged this on sainsfilteknologi and commented:
Global Warming ???
The scientific firmament
http://bishophill.squarespace.com/blog/2011/11/23/the-scientific-firmament.html
Nothing this last 50 years has been warmer than the Dust Bowl heat waves. All the graphs they talk about in the debates by global warmists are from the last 40 years.
The two places called Mongolia are actually divisions of the ancient Mongolia. What you call “outer Mongolia” is in fact the major historic Mongolia. Mongolians are surprised to hear they are “outer.” The other part of historic Mongolia has been taken over by the Chinese and is called “Inner Mongolia. Referring to Mongolia as “outer” perpetuates the idea that it is “outer” in relation to China. While the ethnic traditions of many in Inner Mongolia are shared with Mongolians, the two countries are dramatically different in terms of human rights and political participation.
Geographically correct is Mongolia or Inner Mongolia.
I am old. For much of my life, it was called ‘Outer Mongolia’ and it amused me to say that here since the warmists who are all so very concerned about our welfare are more worried about the wonderful people who live there and have zero interest in worrying about Americans who are freezing to death nearby.
Actually, historically, ‘Mongolia’ or the Land of the Mongols went from west of Kiev to south of Beijing. It was one of the biggest if not THE empires on earth for many generations.
‘All the graphs they talk about in the debates by global warmists are from the last 40 years.’ Others say that the AGW crowd marks GW from the late 1800s, when the last Little Ice Age ended.
What do you think?
If thats true, it is ‘quite a trick’! Trick millions and blame it on carbon.
off topic…did you read about the leader of South Africa? he took 23? million to fix his estate up.
ΩΩΩ
ELAINE: And that is where all the CO2 taxes will go: to the rich and powerful who will use it to make personal paradises.
“the problem with all this noise about the climate is the PROJECTION going on as if we are not on the knife’s edge of another Ice Age”. Elaine you have nailed the essence of the discussion. Intrinsic in most academic disciplines is a concept of “critical mass”. As you approach critical mass the laws of entropy dictate that linear relationships and cause and effect will prevail. Once you exceed critical mass you are no longer in a linear function but an exponential function and truly on a knife’s edge. In our lifetime there has been the collapse of the cod stocks that exceeded its critical mass to the downside. In the global warming context the critical mass to be concerned with is the huge co2 sinks of the permafrost and deep oceans. Take care.
The permafrost isn’t permanent. Each previous ice age ended with warmer interglacials than the present one. Despite all that melting, a new ice age hammered down even harder than the previous one. This is a step ladder to colder and colder, not hotter and hotter.
‘to the rich and powerful who will use it to make personal paradises’
thats Agenda 21.
Any time I see the words “hockey stick” there will be a response from me;>)
What? You will sing ‘O, Canada’ and then throw off your hockey gloves and hit someone? 🙂